The 2023 Cleaning Industry Distribution Benchmarking Survey

In our diverse business landscape, especially in the distribution and supply chain industry serving the cleaning industry, staying informed isn’t just an advantage—it is a necessity. Business owners, stakeholders, and those in corporate management need powerful tools that encapsulate the collective voice of their peers. The most important tools come packaged as knowledge.
That’s why ISSA, your worldwide cleaning industry association, has commissioned its first-ever distribution and supply chain survey, a complex and complete overview of the data and statistics distributors and supply chain professionals need to make decisions and plan the future of their organizations.
These survey results offer more than simply numbers and statistics, however. They provide insight into industry standards, forecast emerging trends, and spotlight potential challenges.
For example, when distribution and supply chain professionals were asked in the survey what they would like to see from their supplier partners to serve customers better, the majority chose “product innovation” to top their wish list. Then came “inventory/supply chain management” as the second most important item to them. Better payment terms were third in the list.
When choosing a supplier partner, “quality” topped the list, followed by a close tie of “price” and “on-time delivery,” with “support” right behind.
And let’s not forget emerging technology. When asked what distributors have recently implemented to be more productive and competitive, the list was long with innovations from AI tools to route planning software to warehouse management technology—and many more.
In the following pages, we provide a snapshot of the survey results, information to help you with business decisions, and data to help you drive innovation. Dive right in and read, analyze, and use the following information as you continue to grow your organization.
You can download this report and see these results online at issa.com/distribution-survey-2023, along with information about additional data available.
About this report: The data recorded in this survey are based on results from distribution and supply chain professionals responding to invitations to participate in this survey.
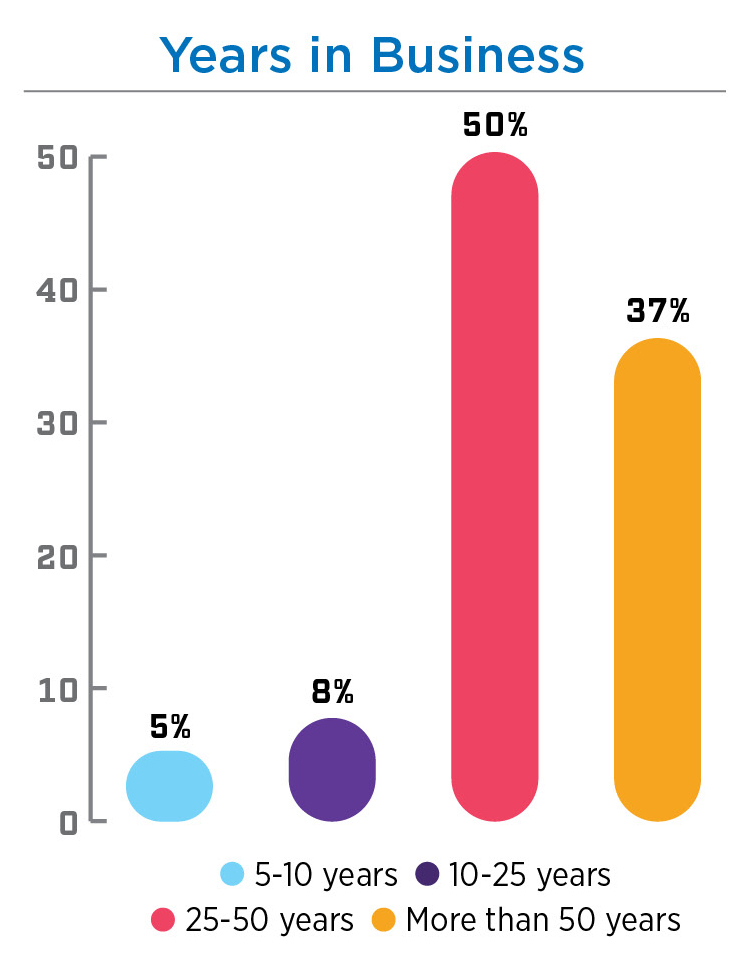 There are many legacy distribution companies in the cleaning industry, all contributing to the growth and profitability of customers served. Approximately 50% of survey respondents have been in business for 25-50 years, with nearly 38% at 50 years or more. For end-users, choosing a distribution partner with a proven track record that provides accurate information on products and services is key to success. Many equate the longevity of a company with experience and value. In addition, approximately 50% serve customers from one location, with 35% using 2-5 locations, and just under 10% at more than 10 locations.
There is power in numbers. Being part of a buying group or a group purchasing organization (GPO) gives purchasers more muscle when it comes to ordering and obtaining preferred pricing. It also solidifies relationships between sellers and buyers. While the buying group and GPO strategy works for all companies, it especially benefits small and medium-sized businesses that might need improved negotiating power, reduced administrative burden, support and education, and more. In the cleaning industry, 45% of distributors are part of a buying group, with just 3% as members of GPOs. Yet, some do both, with nearly 20% belonging to both a buying group and a GPO.

 Driving revenue is the lifeblood of any company and often serves as the primary indicator of the health of a business and its ability to grow and sustain operations, which builds confidence in clientele. For distribution companies responding to the survey, the vast majority are seeing robust sales. A small percentage (3%) are at less than $500,000 in annual revenue for 2022, with the majority (40%) landing between $5,000,000 and $20,000,000 in annual revenue. There is approximately 5% at more than $30,000,000 in annual
revenue.
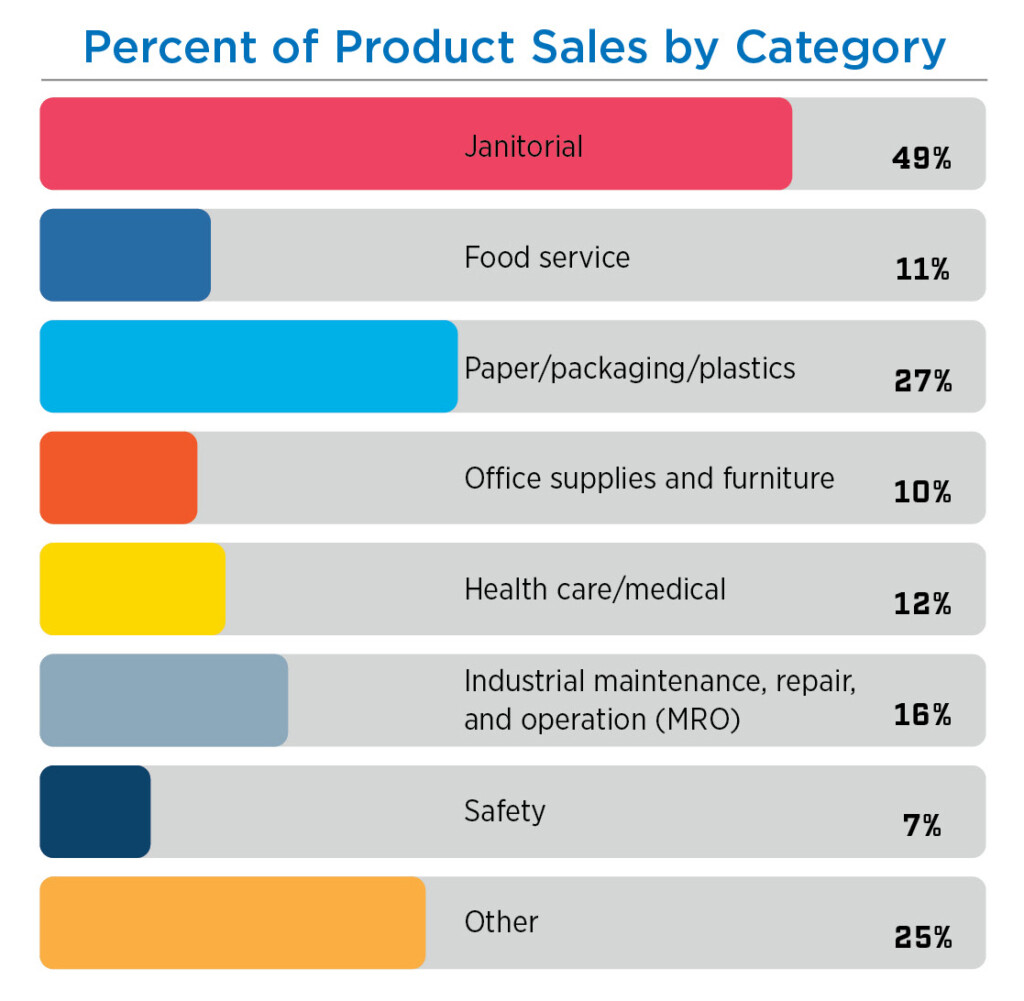
Distribution companies serving a broad clientele offer a diverse range of products for various market segments (see the “Percent of Product Sales by Categories” chart on the next page). Yet this is the cleaning industry, so it is no surprise that the janitorial product category dominated all others. Nearly 50% offer janitorial products more than any other product type, followed by paper and packaging products at 27%, and industry maintenance and repair products at 16%. In total, some eight different product category types were reflected by respondents. It’s evident that distributors and those who are part of the global cleaning supply chain are meeting customer needs by investing in a diverse portfolio of product offerings.
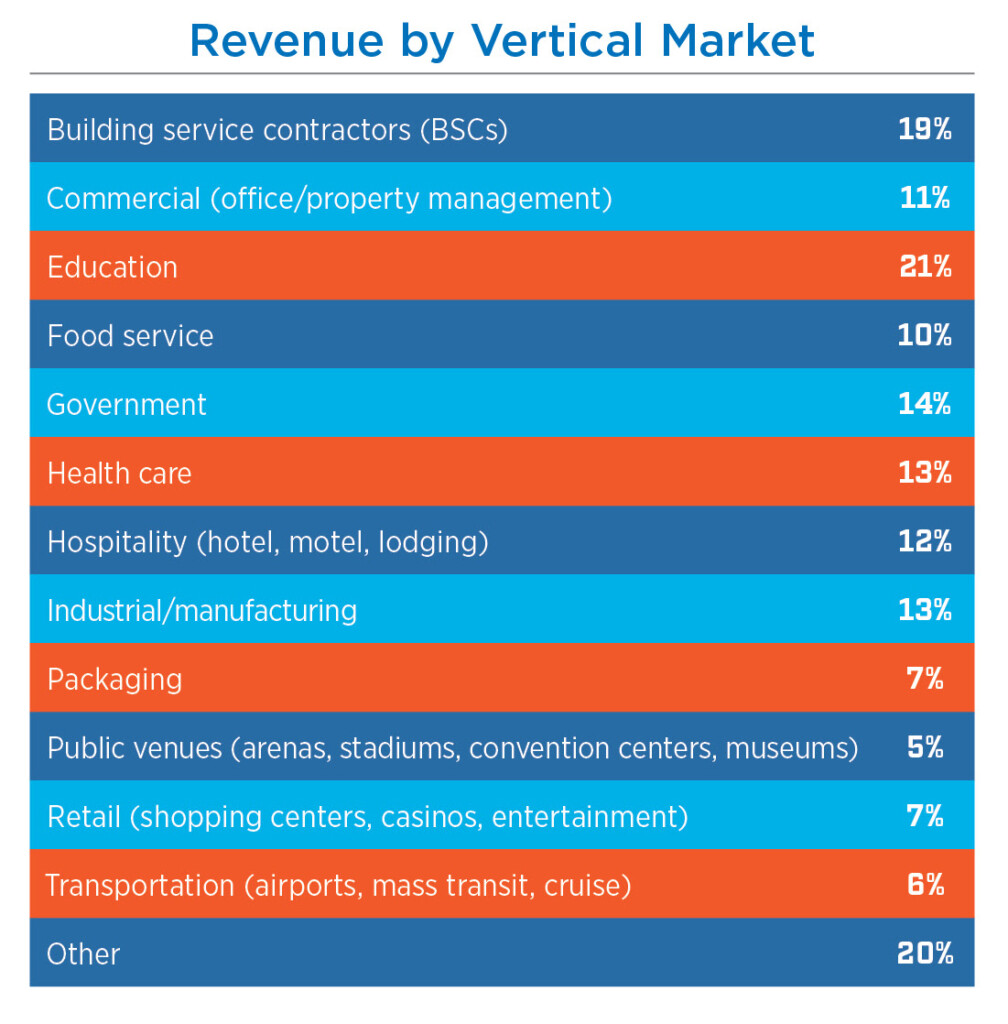
Selling into diverse vertical markets is smart business (see the “Revenue by Vertical Market” chart above). It’s a strategic move to focus on different yet complementary organization types. Risk diversification might be top-of-mind for many smart distribution entrepreneurs, along with creating a stable revenue stream with greater growth and profit potential, as well as with brand resilience. And thinking of the sales force, this provides more cross-selling opportunities. By market segment, education topped the list, with 21% of respondents making that their primary focus. Coming up next was serving the building service contractor (BSC) market at 19%, with health care, hospitality, commercial facilities, and food service following, in that order.
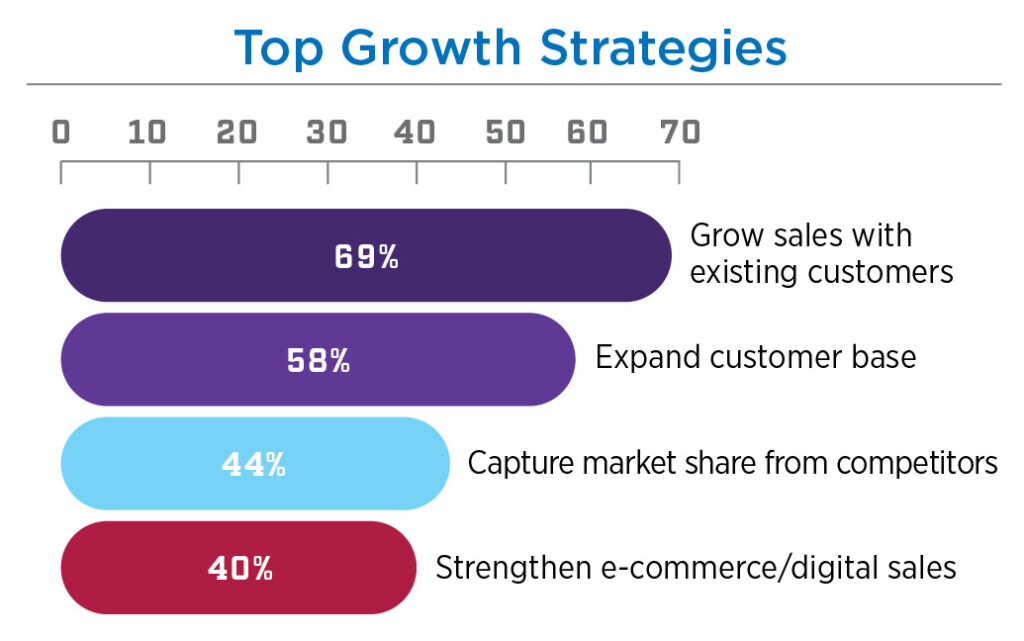
Distribution companies seeking to thrive in today’s competitive and complicated marketplace are smart to employ a combination of traditional and innovative growth strategies (see the chart “Top Growth Strategies” below). Some respondents indicated they were growing, with some strategies including increasing warehouse capacity and increasing the sales force team. Yet the vast majority see their existing customers as key to additional growth, with nearly 70% planning to sell more to existing clientele, with 58% looking to expand their customer base. Then we have nearly 44% who will not only do that but also look to capture market share from their competitors. Almost 40% of those surveyed indicated they have strengthened their e-commerce/digital sales strategies to be more competitive.
In other data relating to growth strategies, many indicate that adding more outside sales staff is planned. However, that traditional role is also the most difficult to fill, according to nearly 70% of those surveyed. Most offer a mix of salary plus commission to their outside sales team. In all, there were more than 10 growth strategies as part of this survey, in addition to other data collected.
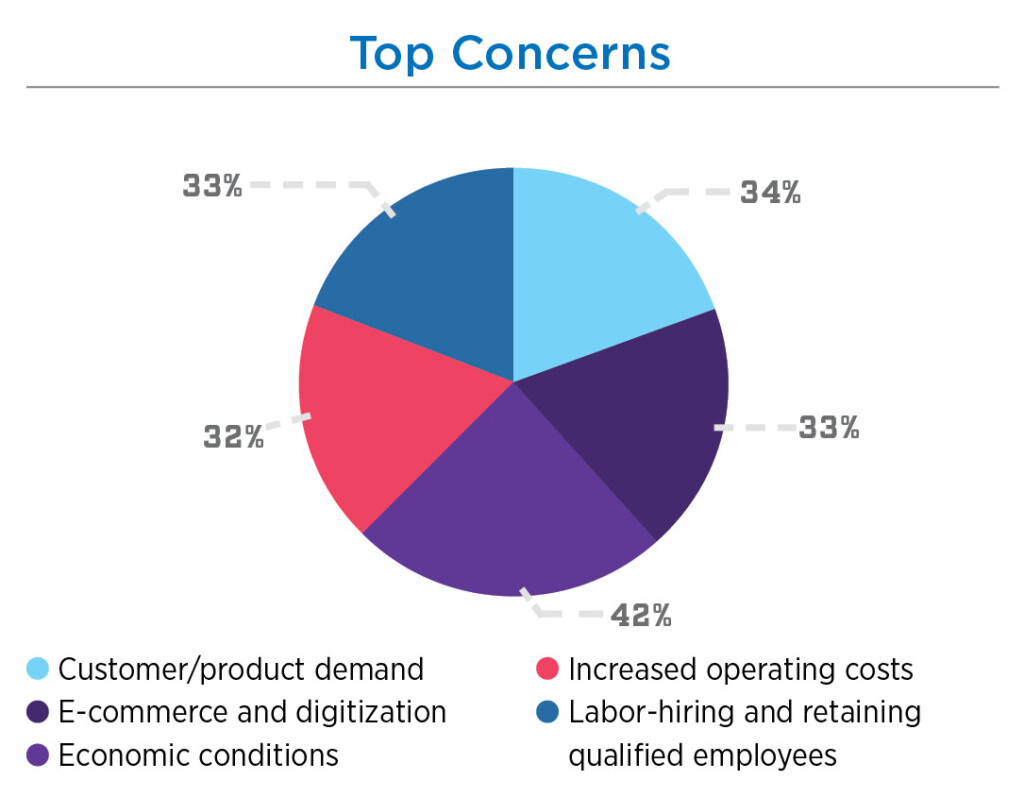
While most survey respondents indicate a healthy organization and growing profits, that doesn’t mean there aren’t concerns. When asked about their top concerns (see chart above) in the coming year, economic conditions topped the list at 42%, followed by customer and product demand at 34%. E-commerce and digitization are creating headaches for some respondents as well, with 33% citing that as something they are watching and analyzing. Some (20%) are concerned about the increase in mergers and acquisitions and how that can impact their own profitability.
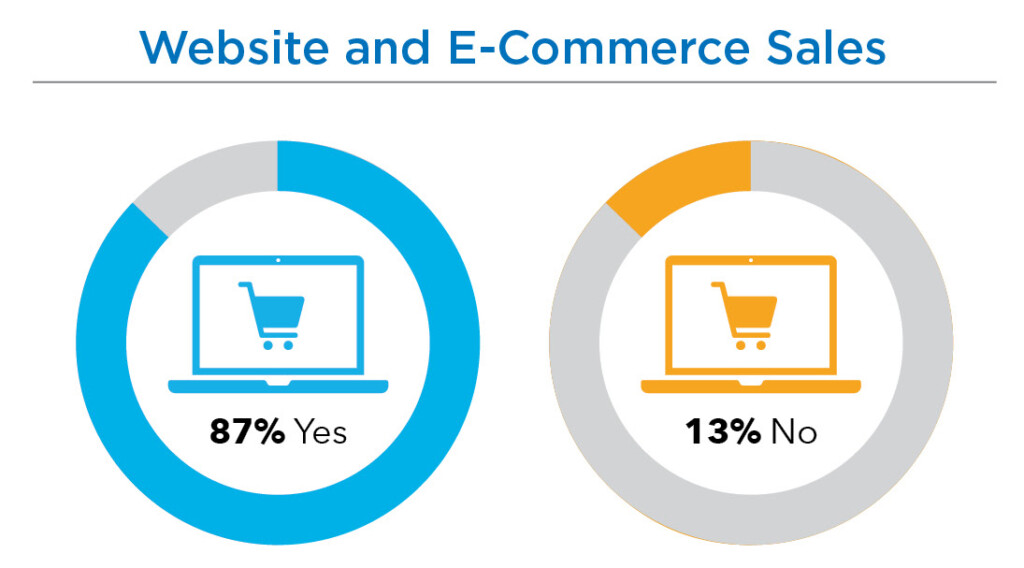
Everyone buys online, especially consumers. Yet business professionals are increasingly purchasing products by tapping into the power of the internet (see “Website and E-Commerce Sales” chart below). Distribution companies are responding by offering e-commerce solutions. When asked if they were generating website or e-commerce revenue, 87% said they were offered the option and saw sales. Yet in a follow-up question, the percentage of overall sales seems to avoid the e-commerce world, with 45% seeing less than 10% of revenue from online purchases. Only 6% of respondents see more than half of revenues tied to e-commerce efforts.
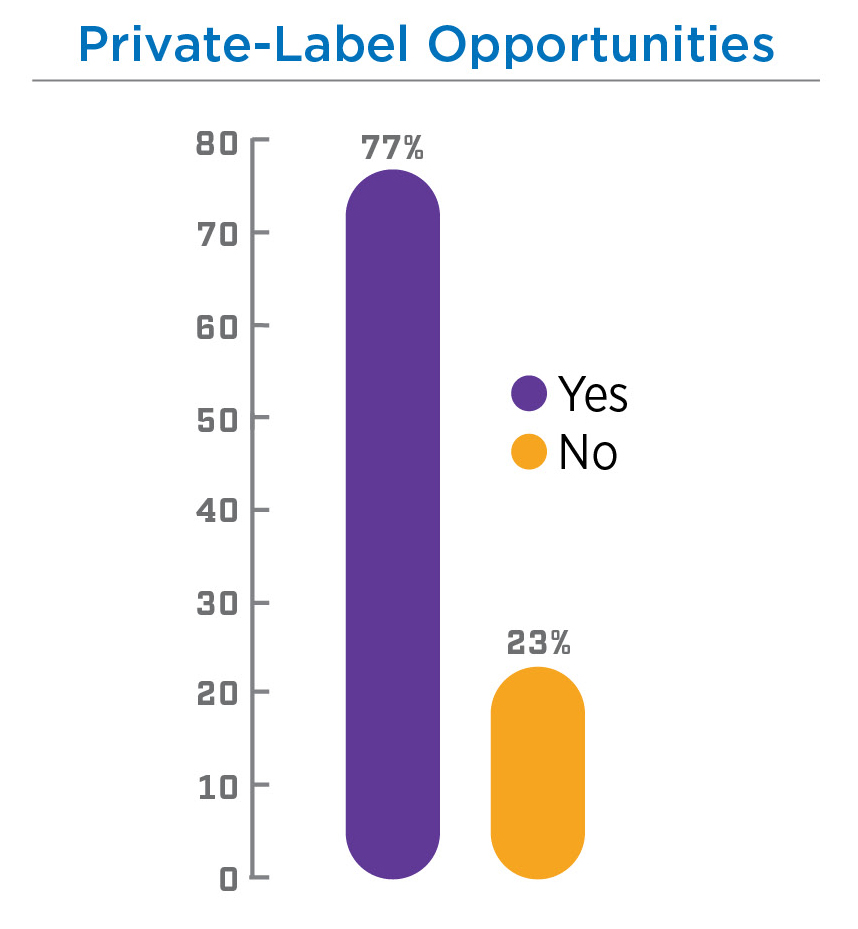
Some say there is nothing more reliable than providing private-label product lines, as those sales are to organizations that will purchase and consume large amounts of products. For distribution, this strategy seems to be a smart move, with more than 75% of respondents engaging in private-label offerings. Is this the most profitable move? That can be debated as 52% said they see less than 20% of revenue tied to private-label product lines.
The bottom line
Respondents were asked additional questions about revenue, sales, and profitability. Nearly half of those surveyed indicated they saw an increase of more than 10% of gross sales revenue in 2022, with an increase in profits compared to 2021. The overall gross margin for 2022 was more than 40% for the largest segment of respondents. And the future? For 2023, more than 30% see this year as profitable, with indications pointing to an increase of another 10% in revenue growth.
You can download this report and see these results online at issa.com/distributionx-survey-2023.